This is an old revision of the document!
Mass Haul
The beginning of this page is intended to set the stage so that common ground exists for readers. Mass Haul is the movement of material. Typically dirt or rock. Mass haul calculations are made in order to determine the logistics of moving materials: how, when and with what. A mass haul analysis is done with a mass haul diagram and a mass haul report. The diagram is a graphical representation of the movement of materials and the report is has the details of amounts, ordering and stations locations. Note that mass haul analysis is most commonly done for road construction.
Figure 1:
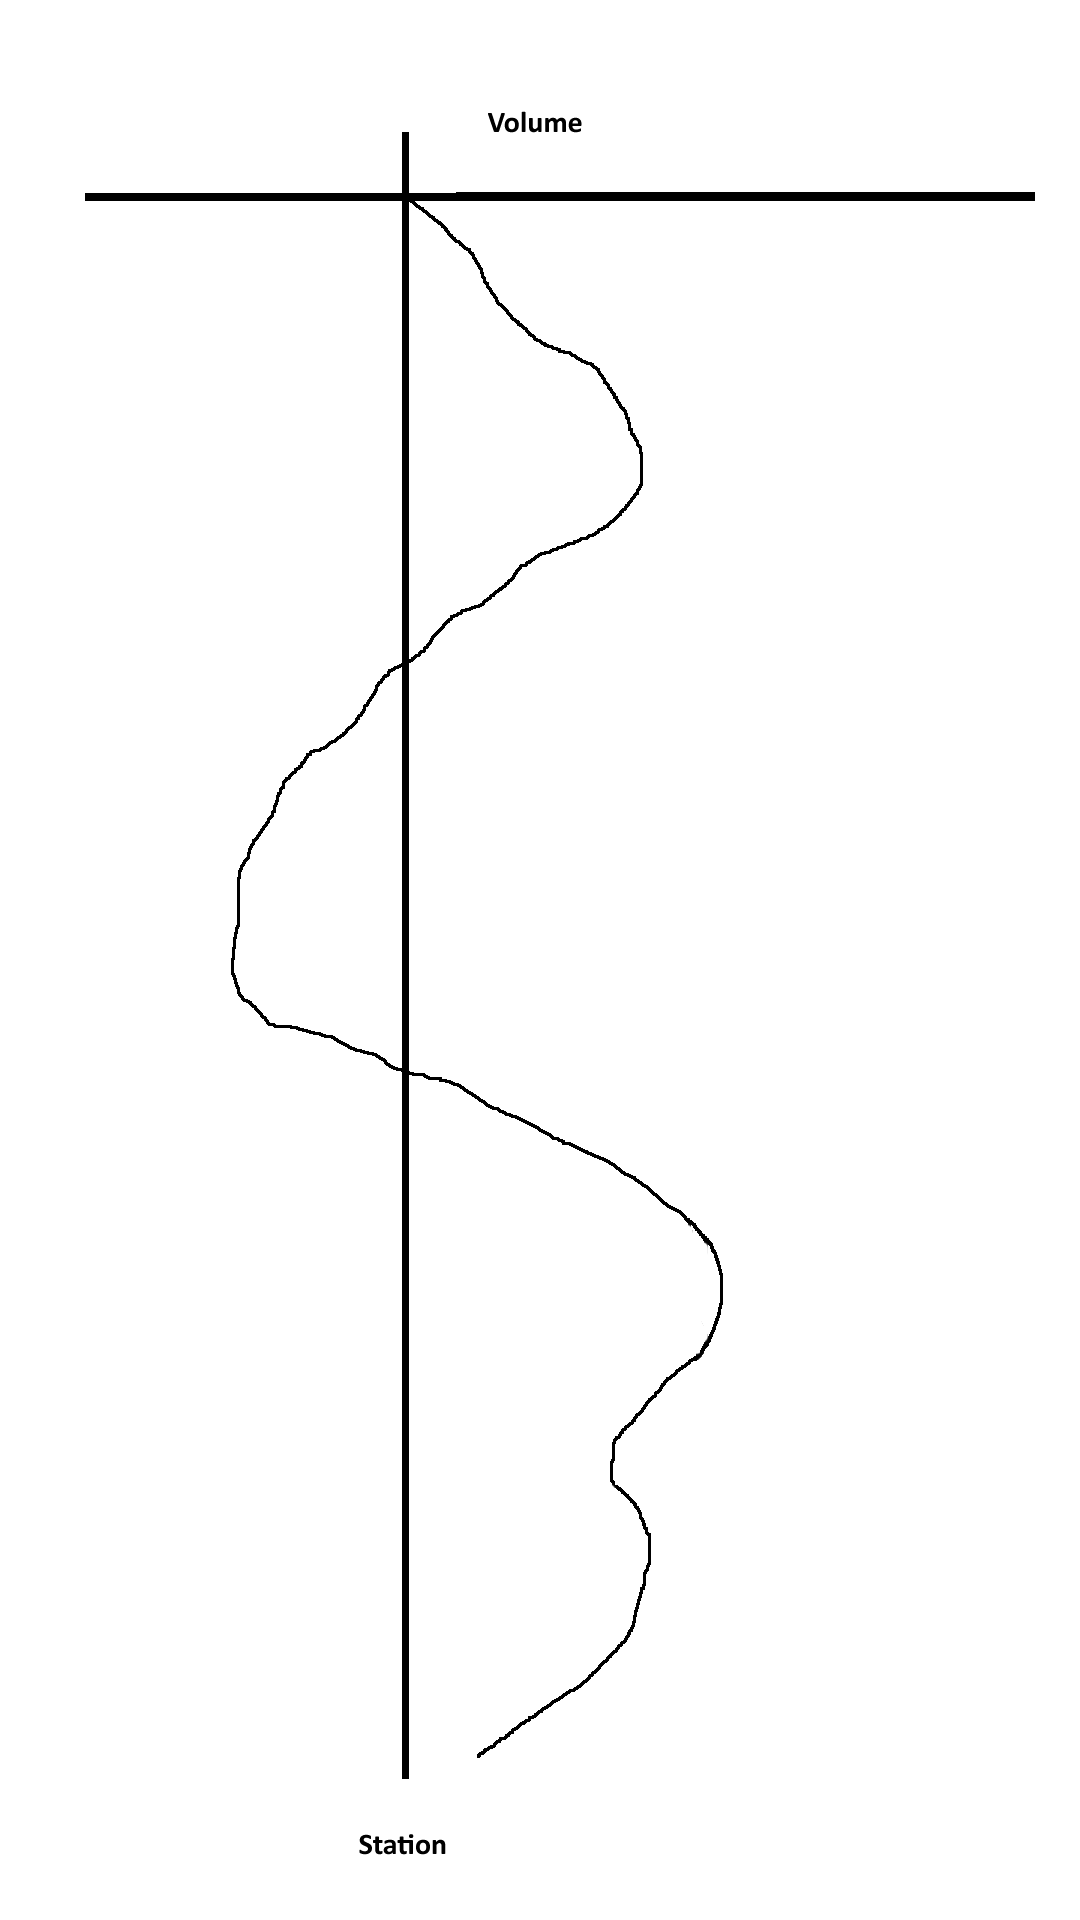
A Mass Haul Diagram in its simplest for is a line drawn on x-y axis (Figure 1). One axis is the material volume and the other axis is the station location or distance along the road. The orientation can be portrait or landscape. The line drawn on the coordinate system describes the accumulation of the volume of material as one progresses down the road. If the line is moving up it is in a CUT situation and material volume is increasing. If it is moving down it is in a FILL situation and material volume is decreasing. Note that it is possible to have a negative volume. That means the project needs material.
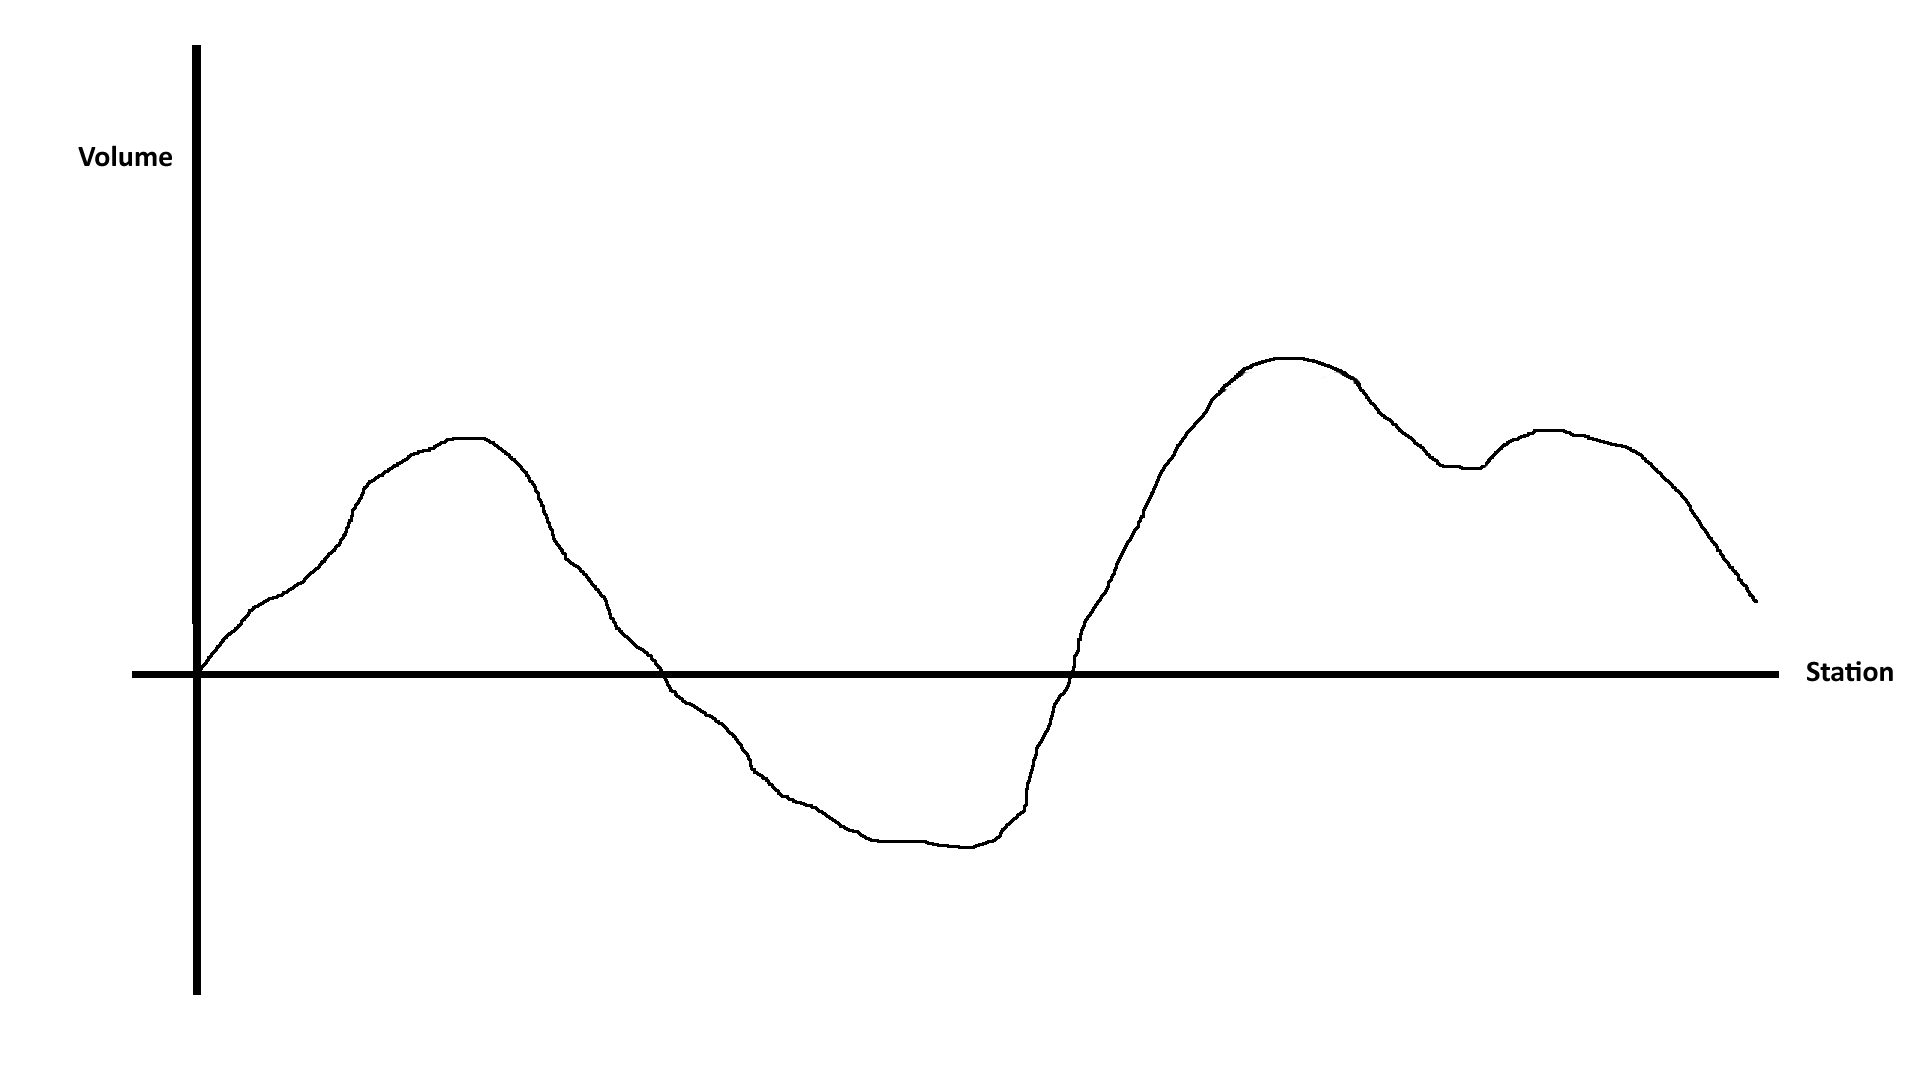
Figure 2:
 When the mass haul line is above a zero (0) volume the project is in a general CUT condition. When the mass haul line is below a zero (0) volume the project is in a general FILL condition. If you draw a line thru the mass haul line at a constant volume any 2 points where the constant value and the mass haul line intersect describe a balance of materials: an equal amount of cut and fill material. So in Figure 2 points A-B, A-C, A-D describe a balance of material. Note that is can be any 2 points so C-B also describes a balance.
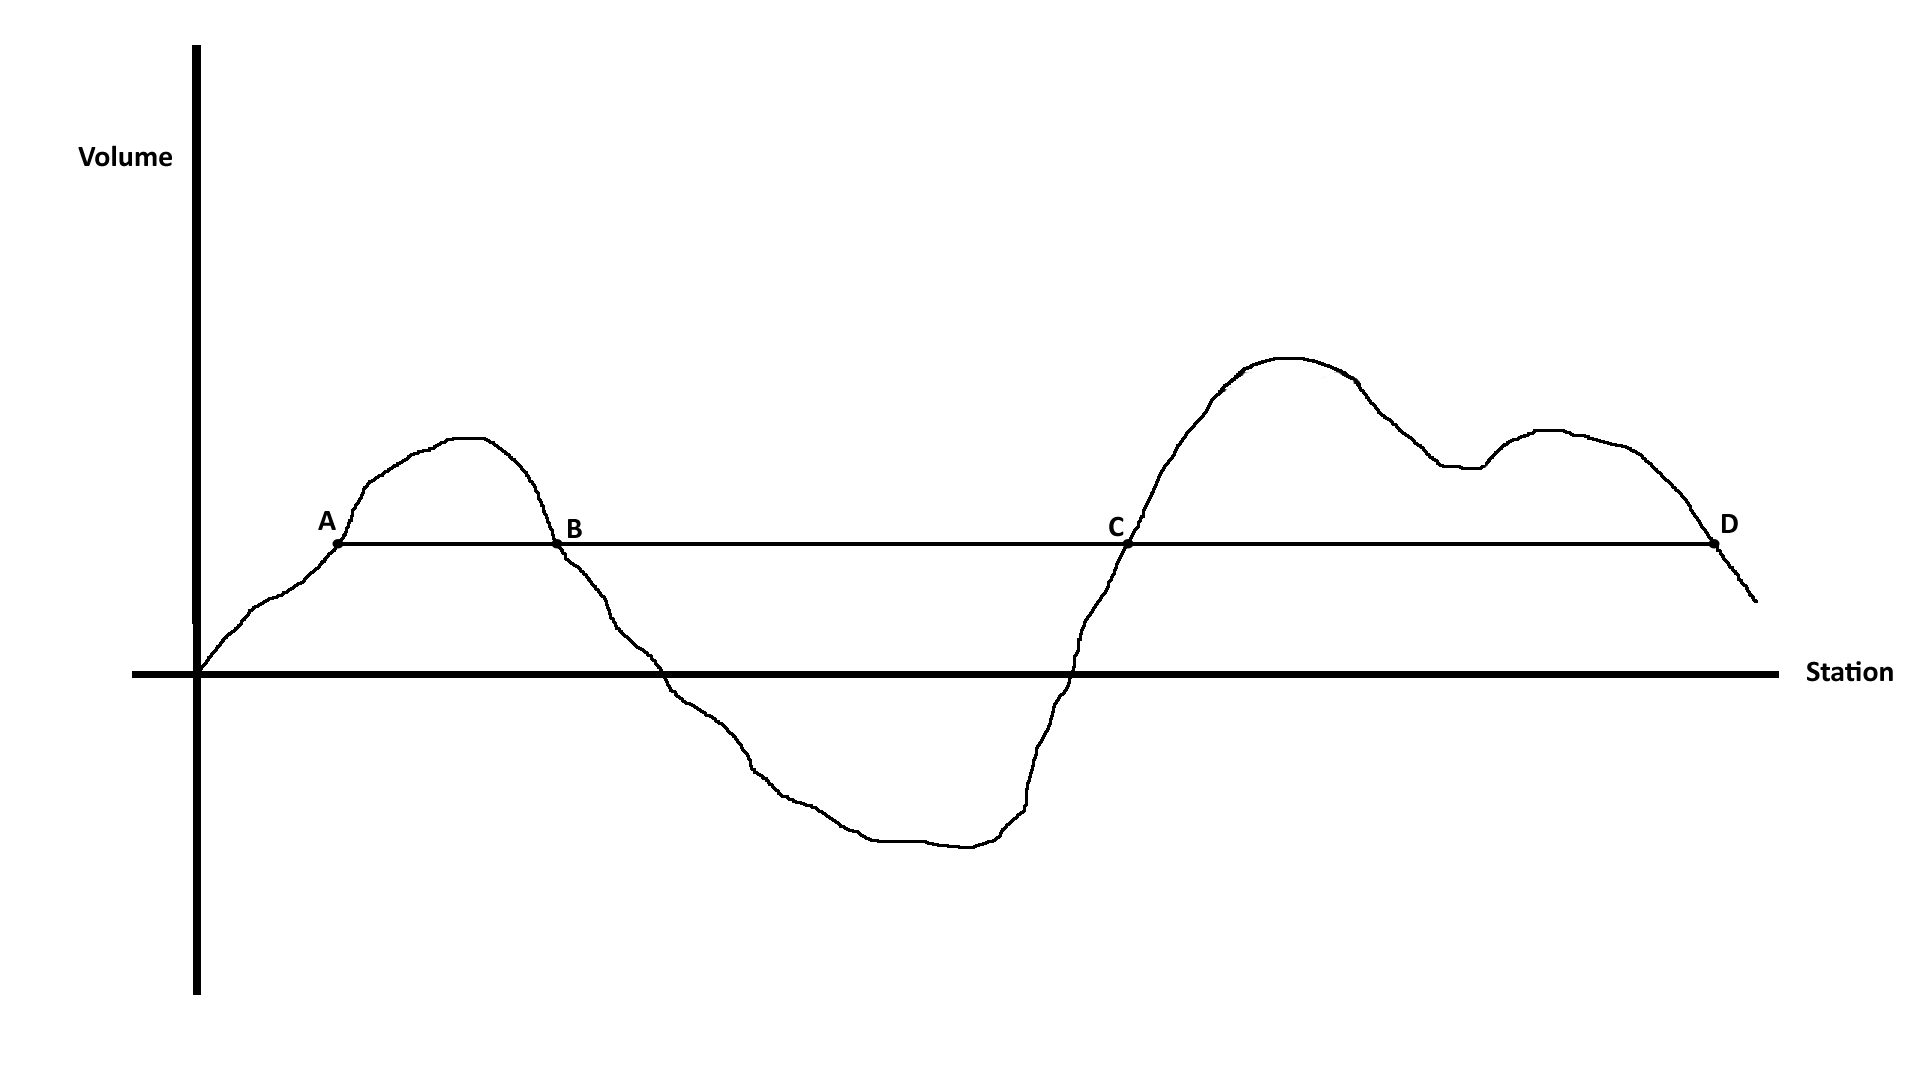
Figure 3: 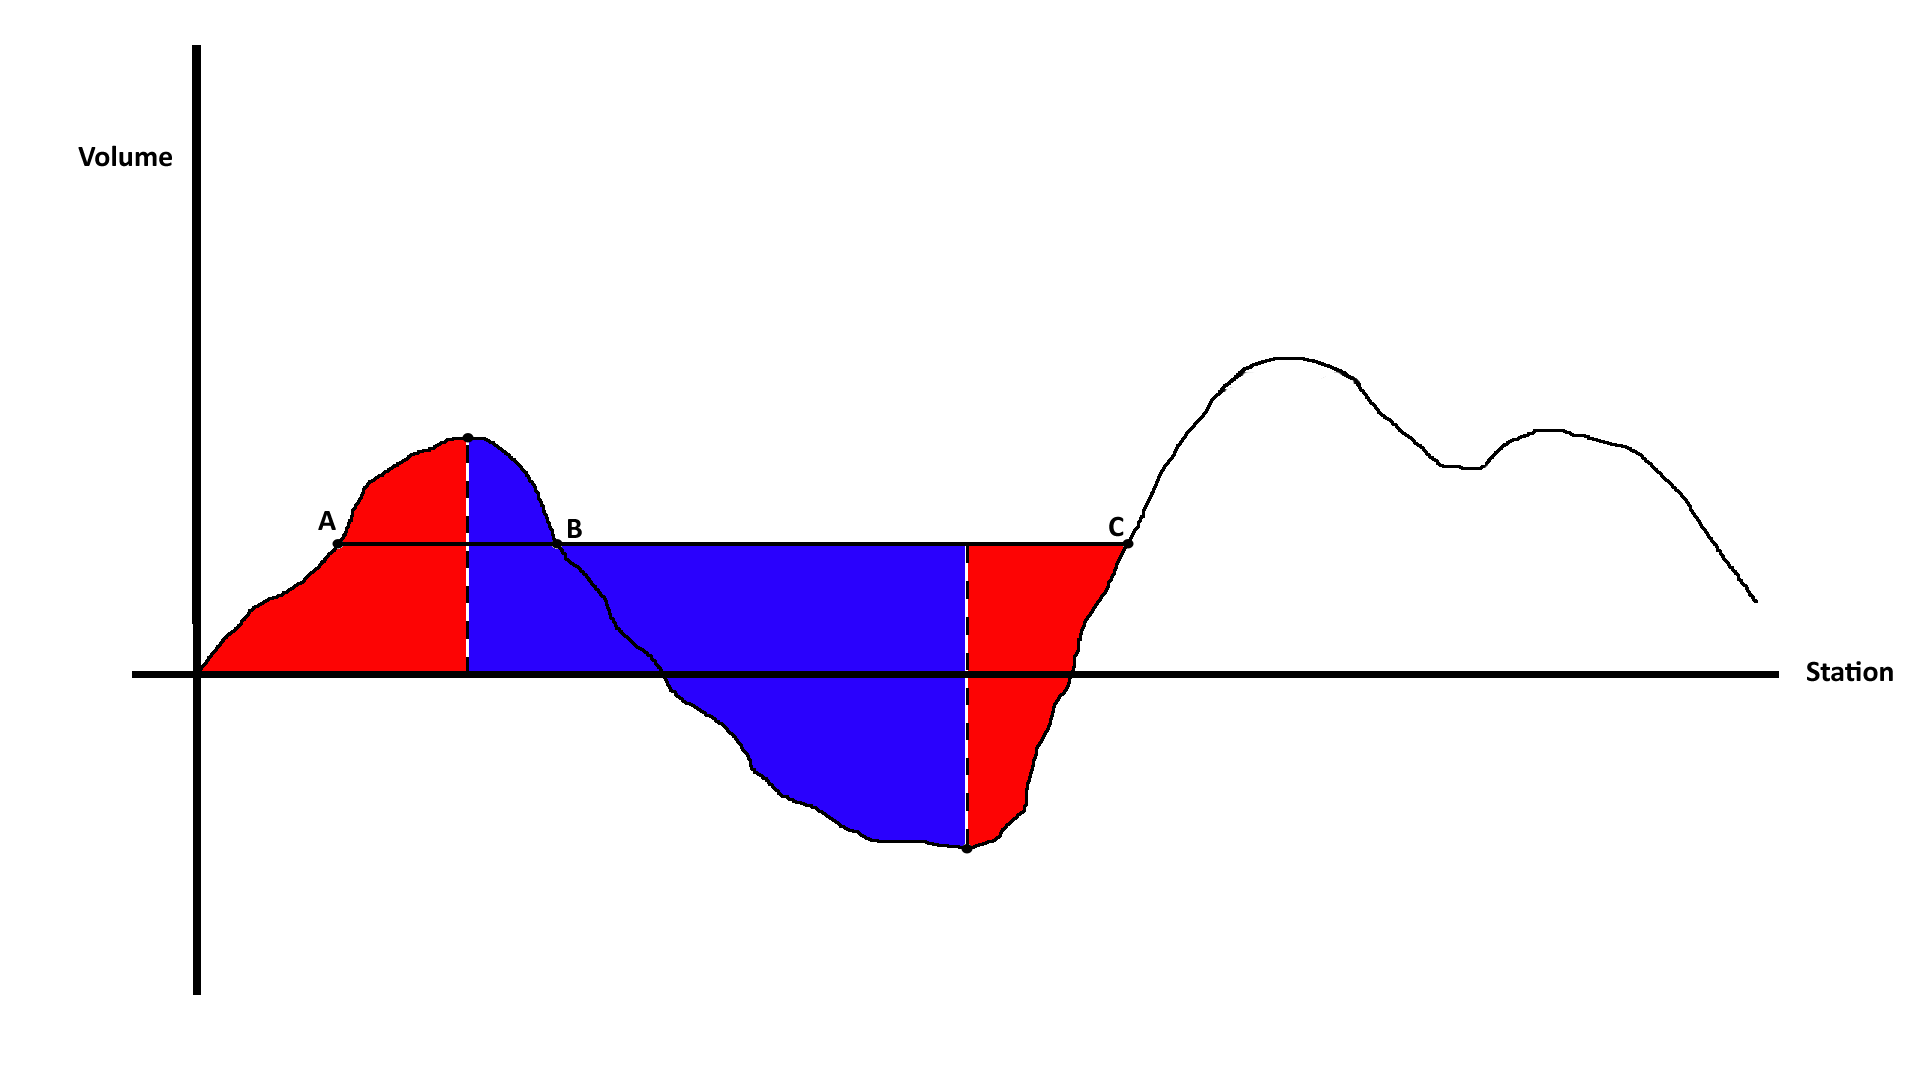
The direction does not matter as one always moves material from cut to fill. So in a way you are forced into a direction. However there is an impact to order. In Figure 3. we show a balance for A-B and another balance for B-C. But if you do A-B you cannot do B-C and vice-versa. In this case the volume of material necessary to go from B to the axis is moved TWICE. So if you tried to balance A-B and B-C you'd end up with a pile of material near B. The point of Figure 3 is to show that material can move “forward” or “backward”. Note that while any 2 points describe a balance typically a point is not skipped so moving material from A to C would be highly unusual. Figure 4 shows an acceptable balance of the 2 areas.
Figure 4: 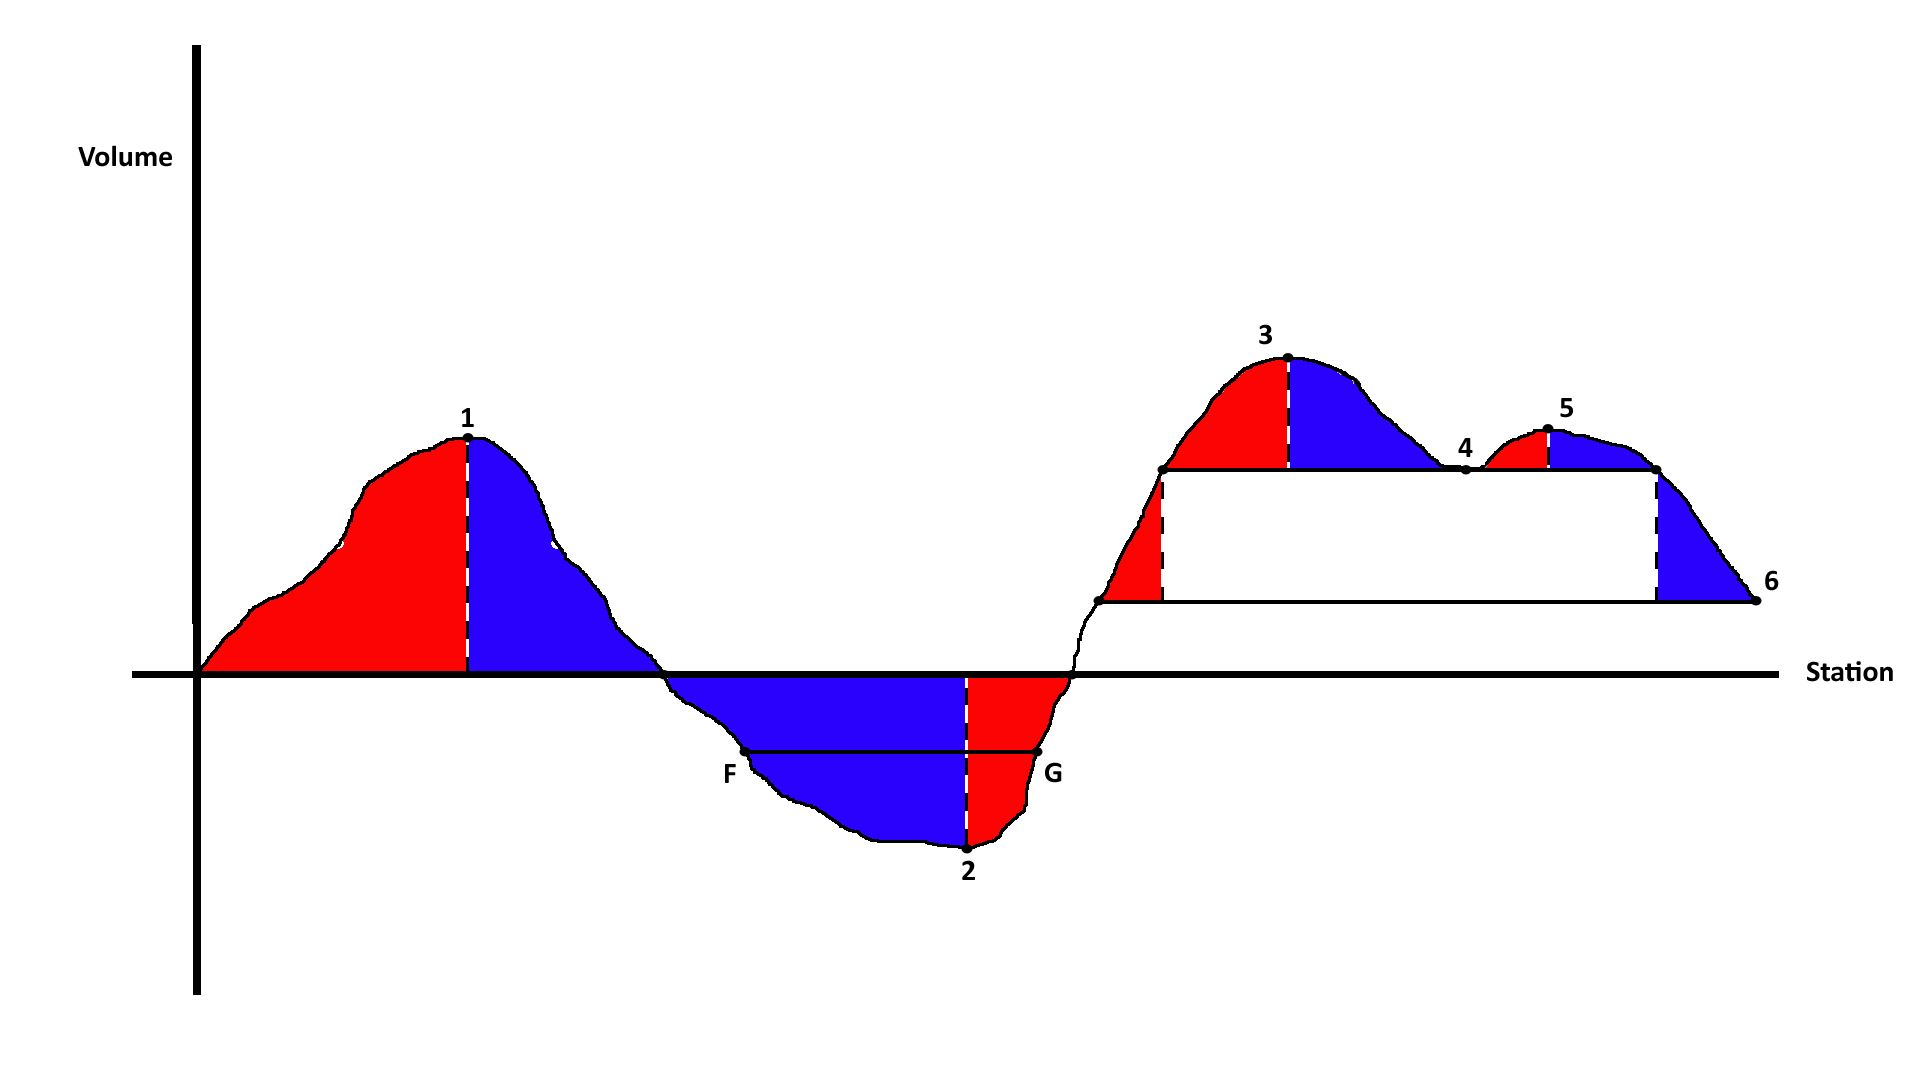
The volume of material is measured by the height of the balance region at the minimum/maximum point to the balance line. In Figure 4 the balance line is the zero line for balance regions 1 and 2. The balance line for regions 3 and 5 goes thru point 4. Balance region 4 has a balance line that goes thru point 6 and a maximum at point 4.