Table of Contents
Mass Haul
Specific Agtek Software Behavior
The highway portion of the software processes the mass haul from the beginning to the end. The diagram is first divided into regions that cross the zero axis. Then that region is processed going thru local minima/maxima first from beginning to end for defined haul brackets. When you get into large haul brackets they can span multiple smaller local balance regions.
The haul balance regions are calculated automatically from beginning to end and the user does not have the ability to choose the balance order. However, the user can add borrow/spoil locations which will cause the diagram to be reprocessed. Borrow/Spoil act over the length between 2 cross-sections at that location.
Mass Haul Theory
Mass Haul is the movement of material. Typically dirt or rock. Mass haul calculations are made in order to determine the logistics of moving materials: how, when and with what. A mass haul analysis is done with a mass haul diagram and a mass haul report. The diagram is a graphical representation of the movement of materials and the report has the details of amounts, ordering and stations locations. Note that mass haul analysis is most commonly done for road construction.
Mass Haul Diagram
Figure 1:
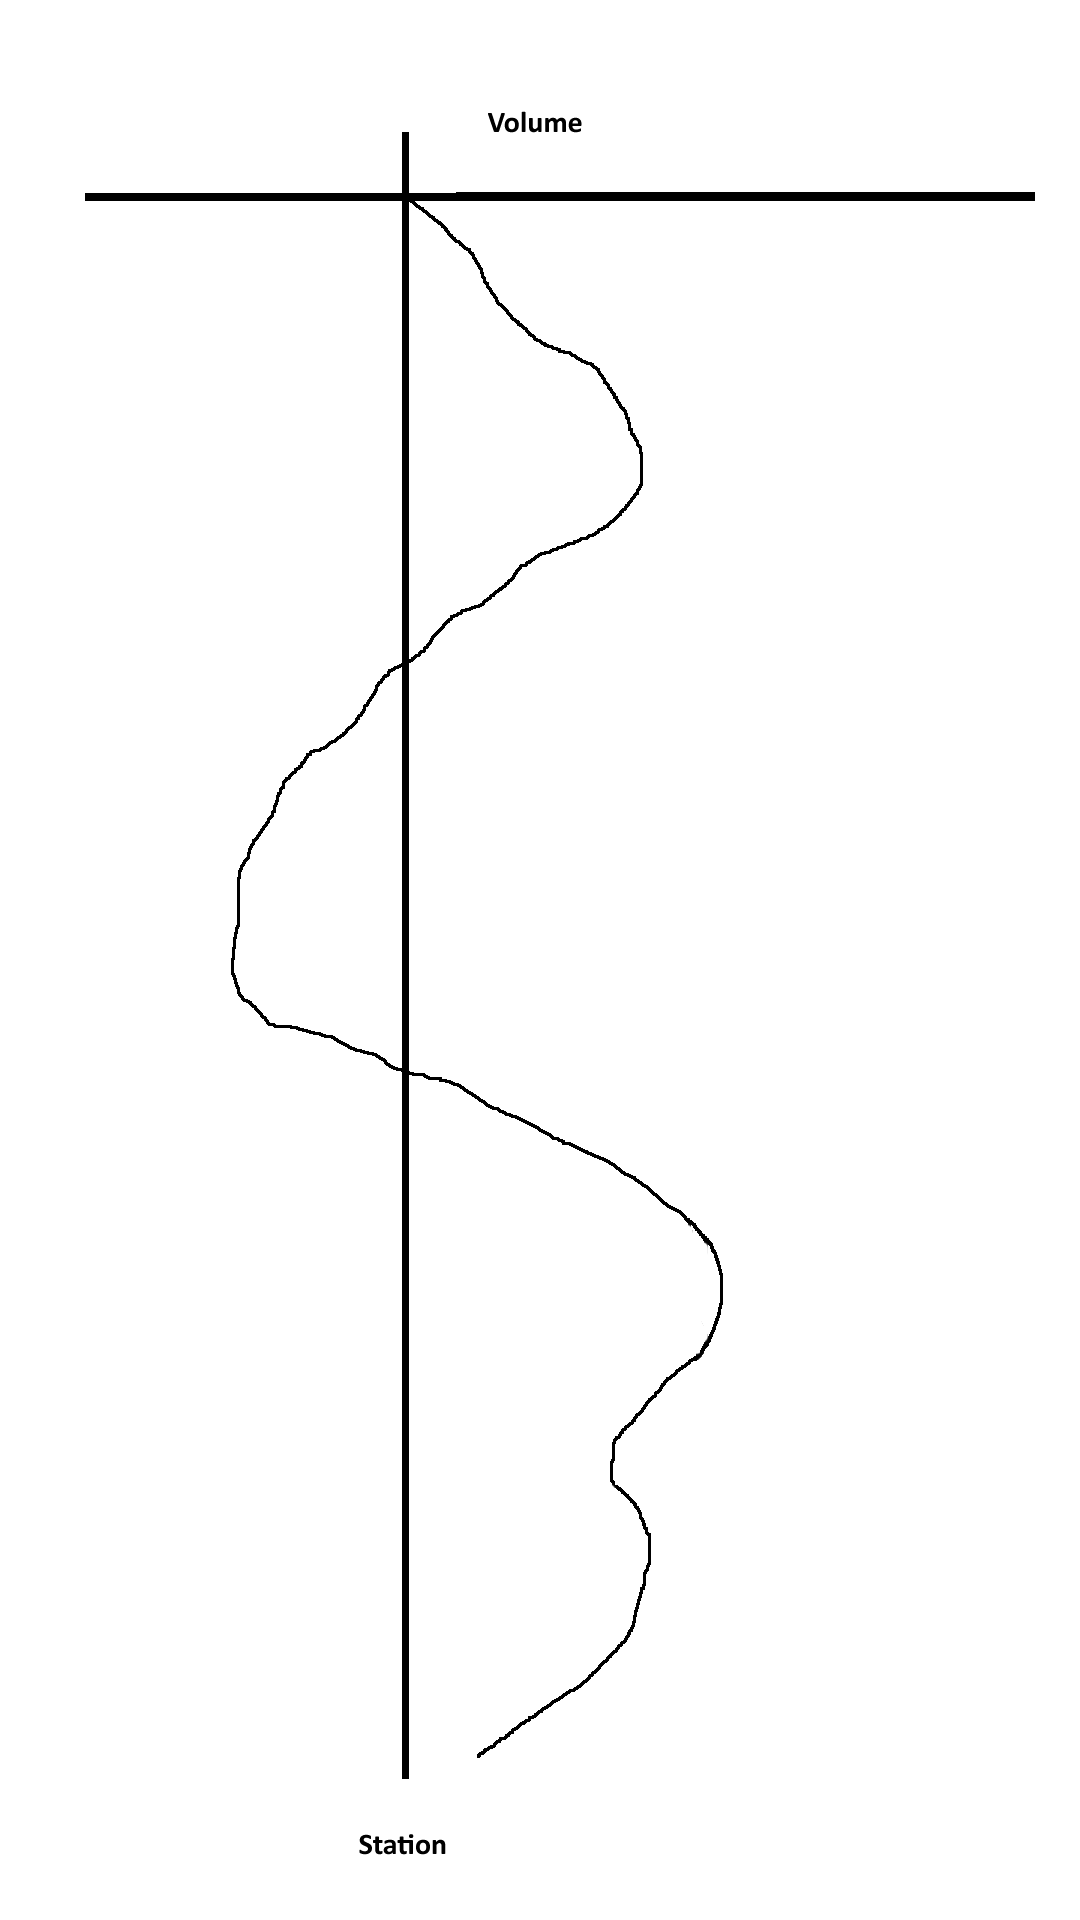
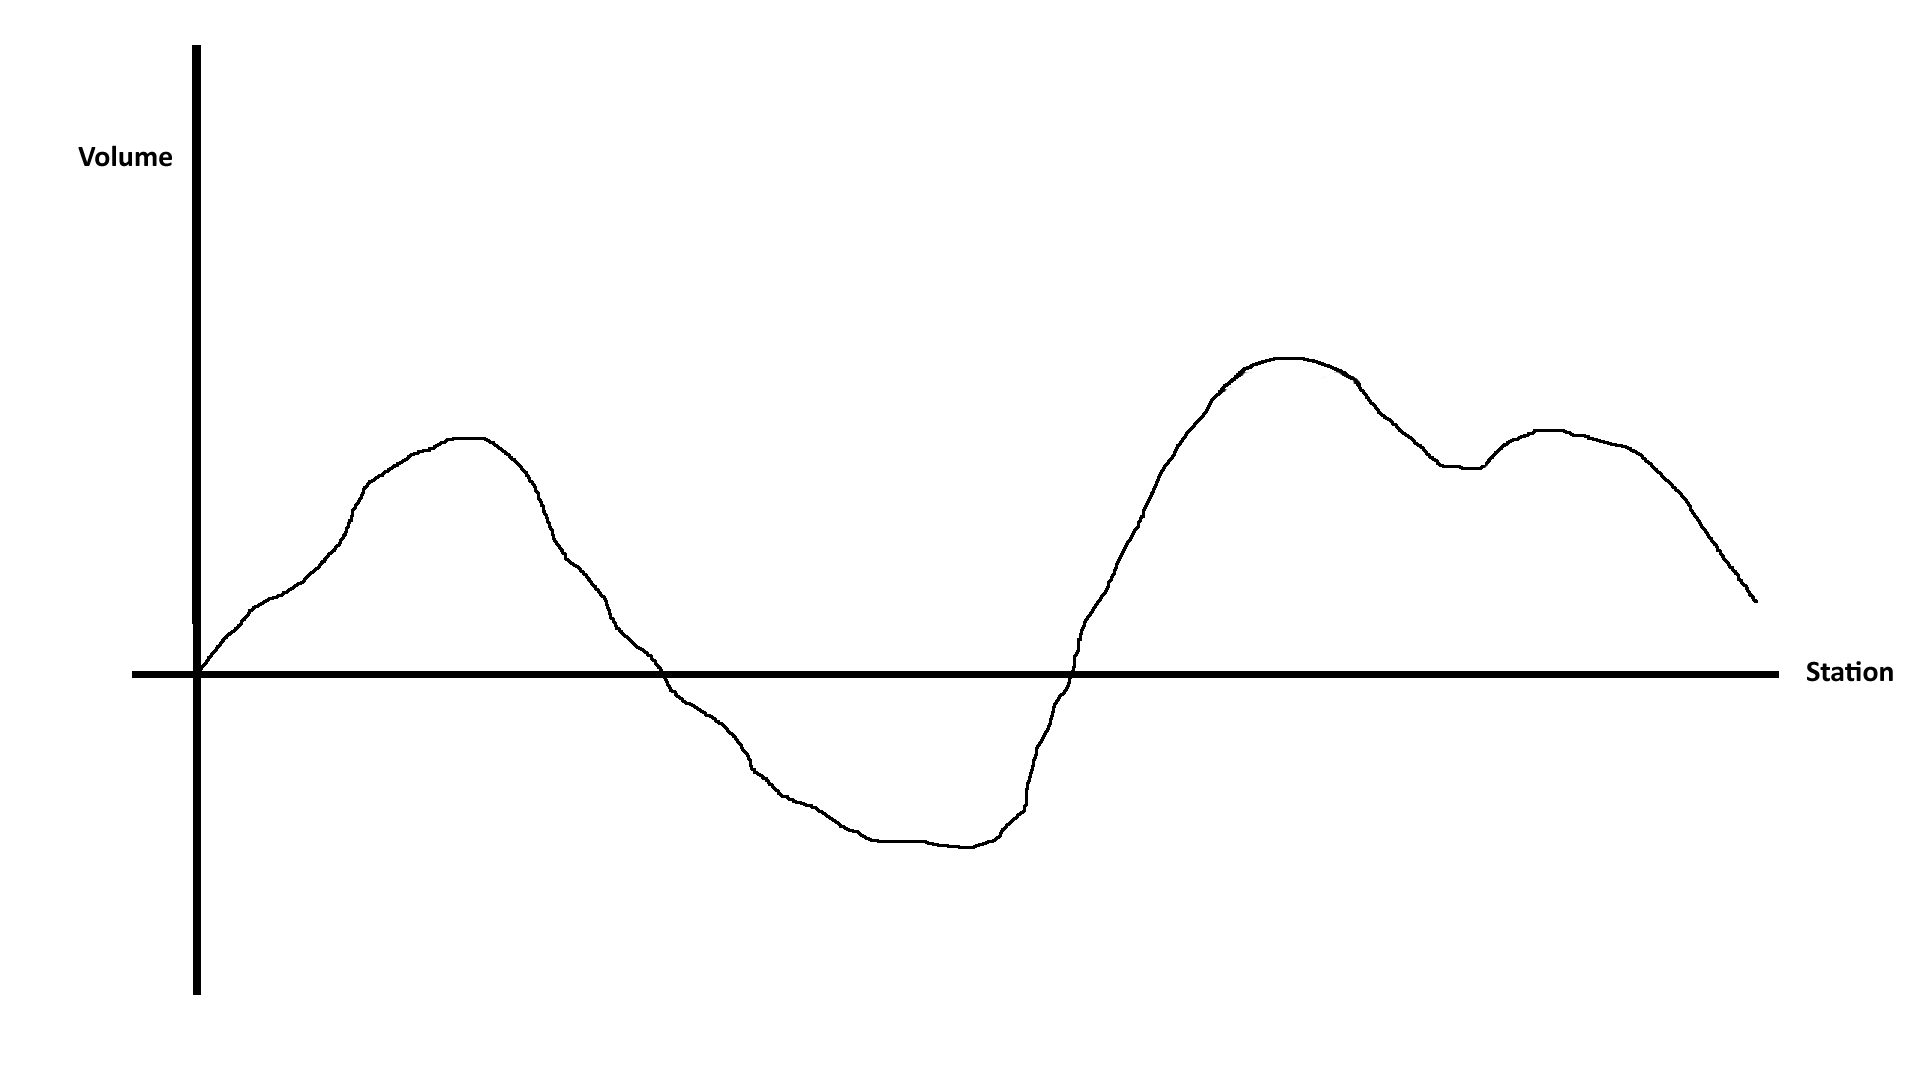
A Mass Haul Diagram in its simplest for is a line drawn on x-y axis (Figure 1). One axis is the material volume and the other axis is the station location or distance along the road. The orientation can be portrait or landscape. The line drawn on the coordinate system describes the accumulation of the volume of material as one progresses down the road. If the line is moving up it is in a CUT situation and material volume is increasing. If it is moving down it is in a FILL situation and material volume is decreasing. Note that it is possible to have a negative volume. That means the project needs material.
Mass Haul Balance
Figure 2:
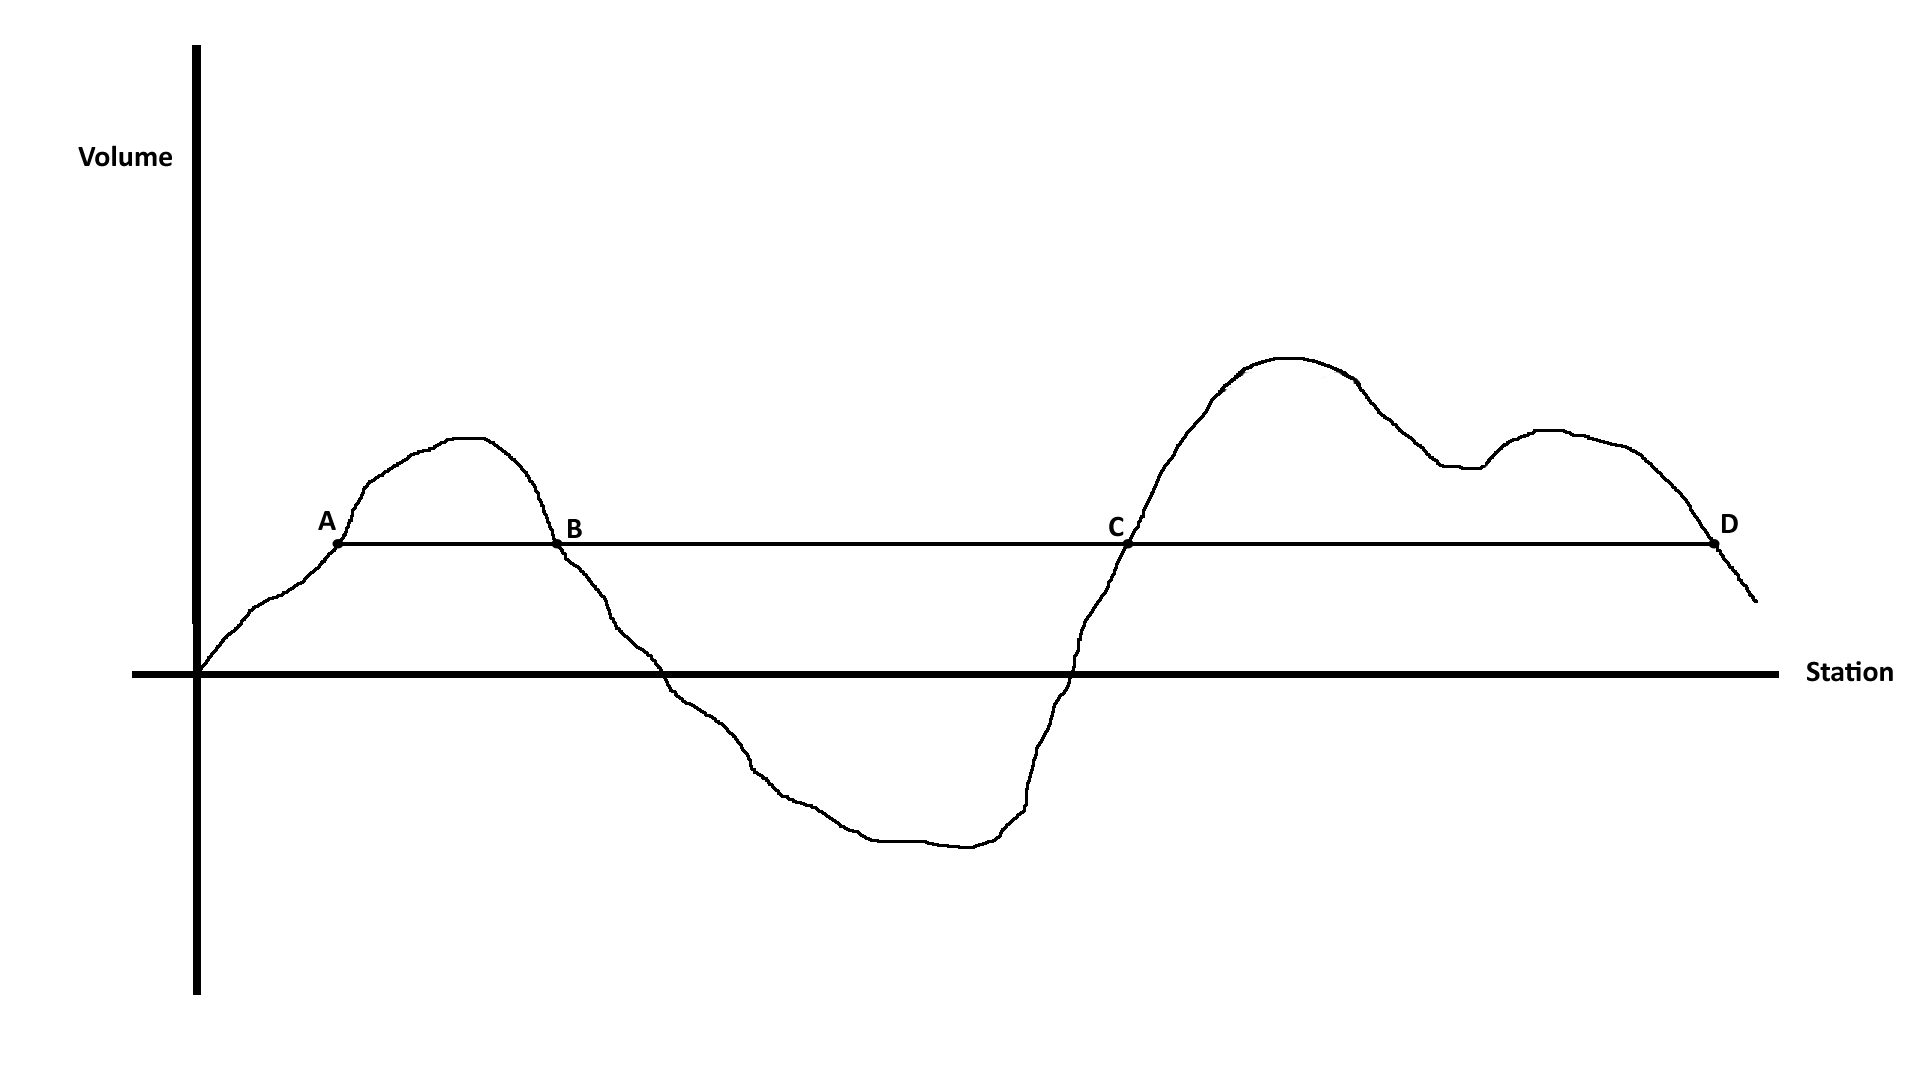 When the mass haul line is above a zero (0) volume the project is in a general CUT condition. When the mass haul line is below a zero (0) volume the project is in a general FILL condition. If you draw a line thru the mass haul line at a constant volume any 2 points where the constant value and the mass haul line intersect describe a balance of materials: an equal amount of cut and fill material. So in Figure 2 points A-B, A-C, A-D describe a balance of material. Note that is can be any 2 points so C-B also describes a balance.
Figure 3: 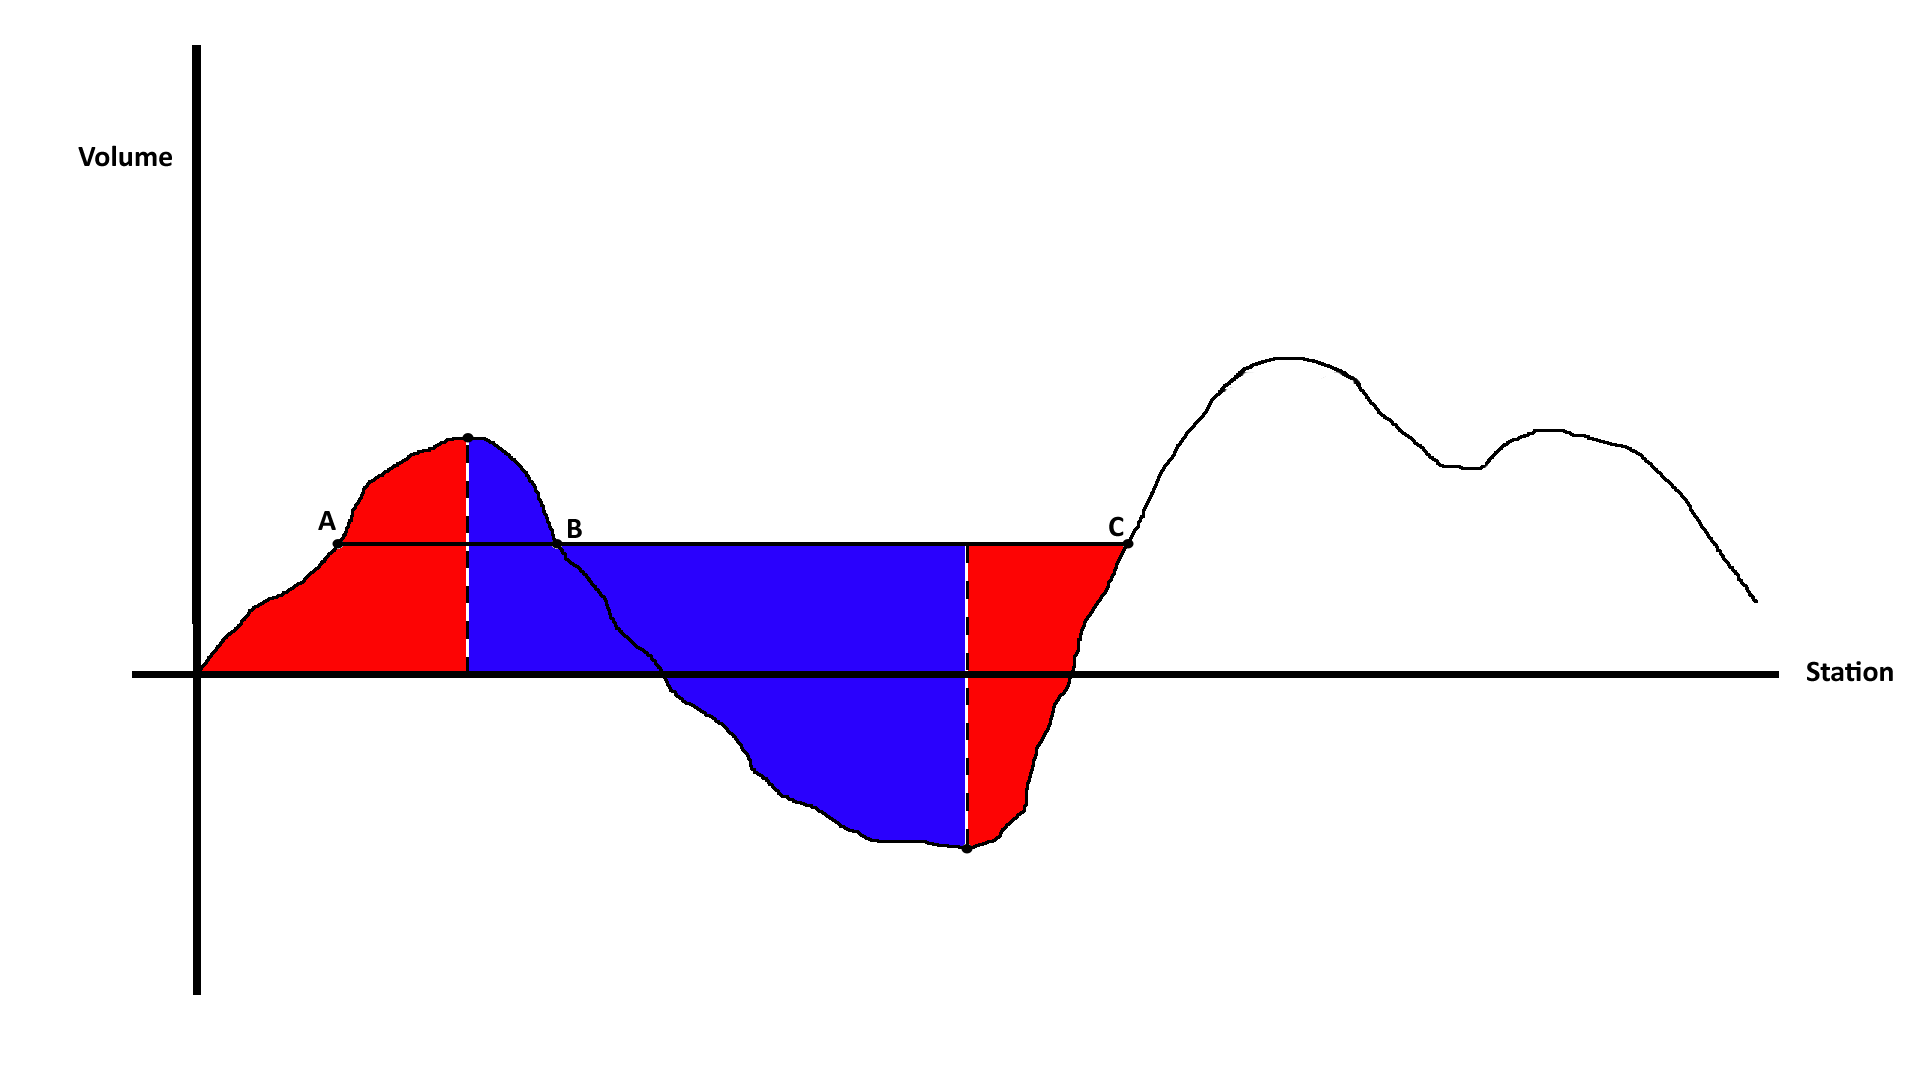
The direction does not matter as one always moves material from cut to fill. So in a way you are forced into a direction. However there is an impact to order. In Figure 3. we show a balance for A-B and another balance for B-C. But if you do A-B you cannot do B-C and vice-versa. In this case the volume of material necessary to go from B to the axis is moved TWICE. So if you tried to balance A-B and B-C you'd end up with a pile of material near B. The point of Figure 3 is to show that material can move “forward” or “backward”. Note that while any 2 points describe a balance typically a point is not skipped so moving material from A to C would be highly unusual. Figure 4 shows an acceptable balance of the 2 areas.
Figure 4: 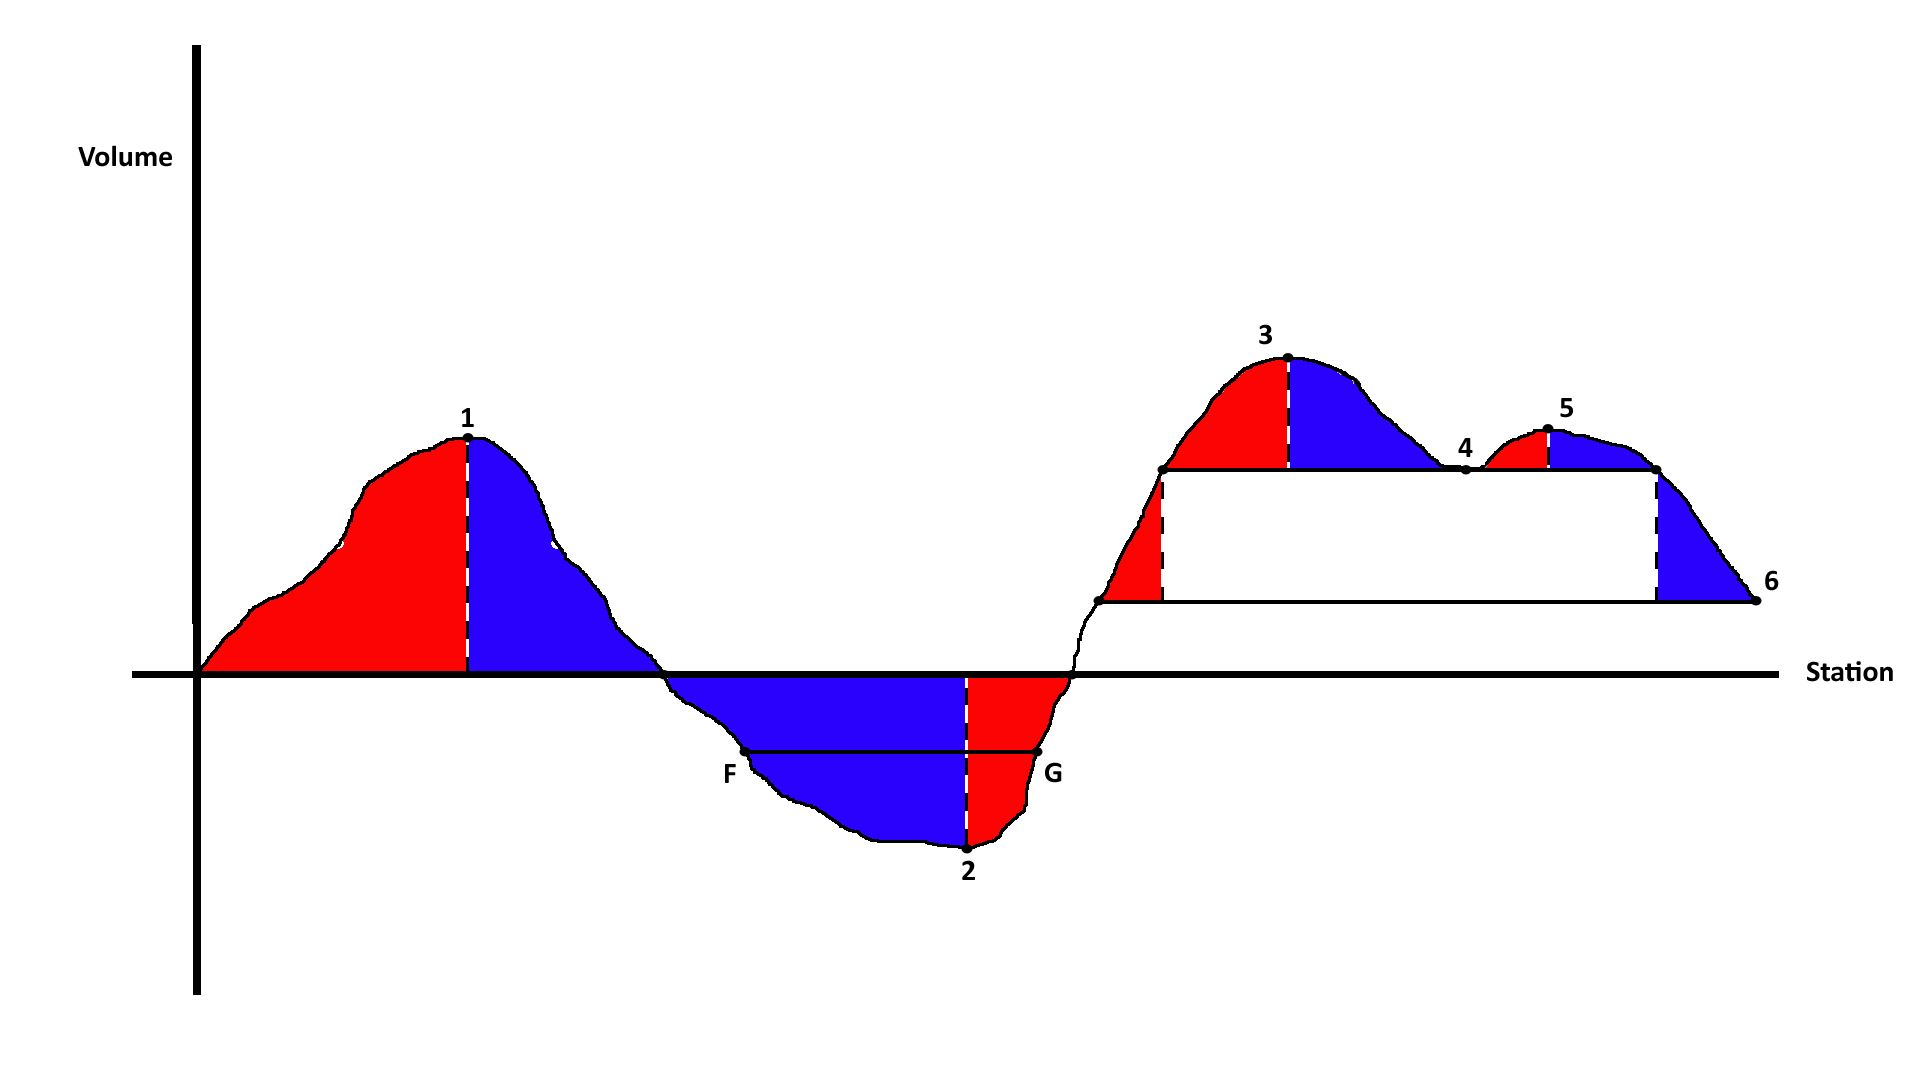
Balance Volume
The volume of material is measured by the height of the balance region at the minimum/maximum point to the balance line. In Figure 4 the balance line is the zero line for balance regions 1 and 2. The balance line for regions 3 and 5 goes thru point 4. Balance region 4 has a balance line that goes thru point 6 and a maximum at point 4. In addition to the volume to be moved it is good to know the average distance the material will be moved. This is done by finding the points corresponding to half of the volume. See Balance region 2 points F and G. The distance between theses 2 points is the average haul distance.
Haul Distance
Haul distances are important because different machines are used to move material different distances. So within a balance region we subdivide it into haul ranges such as < 200 ft, 200 - 1000 ft, and > 1000 ft. The volumes for each range are found by intersecting the balance region by 2 points 200 ft apart and 1000 ft apart. The volume of each range is the height of that range.
In-station volume
There is actually a haul distance that is not “measured.” It is common to cut material from say the left side and place it on the right side at the same station. This is known as in-station volume. The volume is measurable but the distance is assumed to be zero. A project with lots of in-station volume may not appear to haul much material but it will have a very busy dozer operator.
Borrow/Spoil
Finally, it is rare to have a project with the same amount of cut as fill. That means it is common to need to either bring in extra material (Borrow) or haul away excess material (Spoil) In a mass haul diagram these are represented by vertical jumps in the graph. The borrow goes up (or to the right) and the spoil goes down (or to the left). Typically these span 2 cross-sections. If you look at the diagrams shown above the project appears to have excess material at the end and will need to haul it away.